Wednesday, May 30, 2007
Work Period
Hopewell Rocks

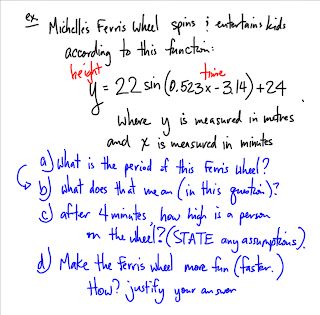
The first question asks: "what is the period of this ferris wheel?"
Using the formula period = 2╥/b, in this case it is:
Period = 2╥/0.523
if you put this into your calculator, then you will get 12.01. Do not round it off to 12, because Senior 4 Applied has to be accurate to 2 decimal places.
The second question asks: "What does that mean (in this question)"
This simply means that Michelle's ferris wheel makes one complete revolution (rotation, spin, turn, go around) in 12.01 minutes.
The third question asks: "After 4 minutes, how high is a person on the wheel? (State ANY assumptions"
There are many different answers you could have for this question, but you will only get marks if you show what you were thinking, or any assumptions you make that would change the answer
Some people may assume that you get on the ferris wheel at its lowest point, some may assume that you get on the ferris wheel when the graph line crosses the y-axis, along with many other assumptions.
The mathematically correct answer is 4.94, but if you assume otherwise, then the answer will change correspondingly.
And finally the last question states, "make the ferris wheel more fun (faster)" This can  be done by changing x, Mr.Max will not accept an answer like:
y=22sin(100000000000x-3.14)+24
This is unrealistic because if you were going that fast you would be thrown of from the insane amount G-force
You could make it something like:
y=22sin(10x-3.14)+24

We then started Sinusoidal Regression
We went to this web site here, and found a prediction for the Hopewell Rocks
You can load this data into your calculator,
STAT, enter,

Then hit STAT, over to CALC, up one to SinReg, enter, L1, L2, (unless you put them in different columns) Y1,
(Y1 is found by hitting VARS, over to Y-VARS, enter, enter)
it then displays a,b,c, and d
Then we looked up Hopewell Rocks on Google Earth, and that was the end of math that day because we just kept looking up different places like, Mr.Max's brother's house in Calgary, a picnic table, that Mr.Max had supper on. Also looking at people that were walking on the sidewalk, or driving there cars.
I thought it was quite incredible how humans have made such remarkable technology, so sufisticaed, that you can see people walking from space. I think it would be cool if it were live video... but you would need a pretty crazy computer probably.
Also, this is completely random, but a boy shot a boar, (a male wild pig) with a pistol a little while ago in Alabama, it was over 1,000 pounds, and 9 feet 4 inches long!! Click here to see a web site about it.

Well, thats it, have a nice day!
Tuesday, May 29, 2007
ABCD Values
 Many people were confused with the whole "a" is amplitude but "a" is not equal to amplitude. So Mr. Max changed the notes to say that "a" is closely related to amplitude and the absolute value of "a" is equal to amplitude. Hope that makes more sense.
Mr. Max moved on to the "b" value. This time Mr. Max made the notes clear and stated that the "b" value relates very closely with period. Although period does not equal the "b" value.

 Next, came the "c" value. This relates very closely with horizontal shift or phase shift.

Monday, May 28, 2007
SVRSS Math 40SA May 25 2007
 uestions.


 .gesu.edu/mathdemos/sinusoidapp/sinusoidapp.html
Friday, May 25, 2007
Confidence Intervals
This is Wilson scribing again.
Some people might be missing the first half of next week for the Provincial English Language Arts Exam. I write the exam in the morning, so it does not actually affect this math course.
Enough about that, now to some work.
Today we learned about Confidence Intervals “Predicting the mean of a sample”
The main idea is to be able to predict with varying level of accuracy (Confidences) the mean of a sample.
Usually levels of confidence are measured at 90% 95% and 99%.
Mr. Maxx’s nice diagrams might show it even better than I could tell you though.


I hope this helps you (all you viewers out there in the electronic world) to understand.
Thursday, May 24, 2007
Attempting the Unthinkable
Let the mission begin.
Binomial Distribution exists in all scenarios. It includes exactly two outcomes, SUCCESS and FAILURE, which means not success.
Things to remember:
p + q = 1
q = 1 – p
p = 1 – q
q = p!
p = q!
binomcdf formula: ( number of trials, probability of success, number of successes)
binompdf formula: ( number of trials, probability of success, number of successes)
The binomcdf formula is used up to and including this many successes.
The binompdf formula is exactly this many successes.
So after learning all of this information, we tried a couple of practice questions.
The probability that a student at Brandon University uses a particular brand of toothbrush is 2/5. If 6 students selected at random, find the probability that:
A) Exactly three of them use the toothbrush

B) All of them use the toothbrush

C) None of them use the toothbrush

Mr. Max showed us a few ways to do these questions, using our calculator or using his partner Ron's website.
As 2 o'clock rolled around Mr. Max informed us that mission was accomplished. ...NOT!! We still have one more day left in this unit, finishing off Confidence Intervals tomorrow. Our test will still be on the same day, June 5th.
Tuesday, May 22, 2007
Stats


And those are the answers. Just a reminder that our test for stats and periodic functions is on June 5th.
Friday, May 18, 2007
Question #15
Question #12
Question #8
Thursday, May 17, 2007
Using Words Rather Than Colors

Z-Scores and Standardized Scores:

Wednesday, May 16, 2007
Infinity is represented on the TI-83/84+ as Egg
This is a commercial for Mr. Max's speech. It really makes you think, and be nervous. Mr. Max also told us that if we get bored while he's teaching to take a look at the 3rd block classes blog.
Anyways, after the speech and telling us to look at the block 3 class blog, Mr. Max began to go over the question he assigned yesterday. I don't know about everyone else but I was lost on that question.

Today Mr. Max showed us four ways that we can solve questions involving Z scores.
(Z score: a measure that quantifies the distance a data point is from the mean of a data set.
basically,a measure of how far from the average of a set of data a number is)
1.) normalpdf(x) and shadenorm(Lowest number, Highest number)
2.) y=normalcdf(Low Z score, High Z score)
3.) www.ronblond.com/M12/norm.big.APPLET/index.html
4.) He also put a spreadsheet into our folder on the course work drive, get there by going to:
coursework, Max's math stuff version 2, 2nd semester block 4 applied40, variability and statistical analysis, STATISTICS
Tuesday, May 15, 2007
Normal Distributions
Mr. Max checked homework from Thursday and he was quite surprised that our sub loved us. Mr. Max, we can't help that we're amazing.
The focus today was on normal distributions, and although we didn't really do any math, Mr. Max assured us that all the rules we have been learning will help us out when we finally get to do some problems.
 Mr. Max tried to trick us by asking if we knew what a frequency polygon was. I really didn't know what he was talking about, so he then asked if we knew what a frequency histogram was, since they are the same thing. While in all reality he could have just said it was a simple bar graph, because then everybody would understand. Tricky, tricky.
Mr. Max referenced the site we were to work on yesterday. He showed us many of the different gadgets on the site that had something to do with normal distributions.

We took some notes and Mr. Max taught us about the bell curve and some distribution characteristics. He also made the lovely diagram above, which turned out quite nicely I might add, to show us the meanings of the characteristics. He showed us the 68-95-99.7 rule. Which didn't really make sense when you added up the numbers in the graph, but Mr. Max assured us "he just knew" and then showed us in the calculator.

For homework we were assigned to try #7 in the review package. Thats right, all you have to do is try and give it your best shot.
P.S. Skew- in statistics skew is the asymmetry of a distribution around its mean. Skew can be positive or negative. So in english this means the unbalanced distribution of the numbers around the average number.
Work Period...
Friday, May 11, 2007


